Tutorial: Processing Names
Read this article: How to Tell Someone’s Age When All You Know Is Her Name.
Let’s do something similar. Let’s find when a person likely was born based on their age.
Getting the Data
You can get all the names of everyone born from the Social Security Administration here:
http://www.ssa.gov/oact/babynames/limits.html
We get the name, the count of people with that name, the sex, and the year born. But wait! Don’t download the data yet. The data involves too many rows to easily process in Excel. Let’s learn some new tools.
- Linux Computer - We will be using a computer running the Linux operating system that I’ve set up using Amazon’s cloud computing tools. This computer already has the data on it.
- MobaXTerm - We need to get to that remote computer somehow. We will use a terminal program. A terminal program is like a web browser, but more primitive. It can receive characters and display characters. There are many terminal programs just like there are many web browsers. The terminal program we will use is called MobaXTerm. Macs are similar to Linux in many ways and already have a built-in program called “Terminal.”
- Command-line tools - Into this terminal we will be typing commands that go to the computer that exists at Amazon. Rather than clicking on tools, we will be typing them in.
Wait, what is the source of my data? The source of this data is not MobaXTerm any more than Chrome is what you’d list for a source on a report. The data comes from the Social Security Administration. That is your source.
Command Line
Again, we will be using something called the “command line.” Rather than using the mouse and menus, we will go old-school and type in commands. We can process more data this way.
Also, rather than use “Microsoft Windows” or “MacOS” we will be using a different operating system called “Linux.”
Another thing that we could do with the command line is to create a file with all the commands we need. Then we could run that file, for each name. We don’t have to recreate our work.
This isn’t something you can do with a graphical interface.
To use the command like interface, we need to learn some commands.
Here is a reference of commands we will need:
| Command | Description |
|---|---|
ls |
List files in the current directory. |
ls -la |
List file details in the current directory. |
cd <dirname> |
Change directory |
cd .. |
Go up one directory |
cat <filename> |
List the entire contents of a file |
head <filename> |
List the first few lines of a file |
tail <filename> |
List the last few lines of a file |
pwd |
Show the current folders (the ‘path’) |
wc <filename> |
Count the words in a file |
egrep '<regex>' <filename> |
Pull out matching lines based on a regular expression |
egrep –c '<regex>' <filename> |
Count matching lines based on a regular expression |
sed 's/<reg>/replacement' <filename> |
Search and replace on a file |
<command> | <command> |
Pipe output from one command into another command |
<command> > file.txt |
Direct the output to a file |
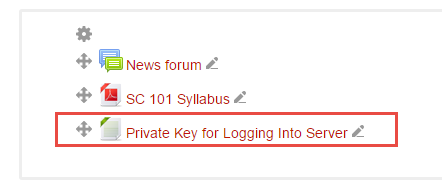
First, from the Scholar class website, find and download the “ssh key” file that that will let us log into out remote Linux server.
Save it somewhere on a flash drive or on your desktop. It will act as a really long password to the machine. Start up MobaXTerm. It is on the lab computers. You can also download it to your computer if you want. Create a new session. Fill out the session to look something like this:
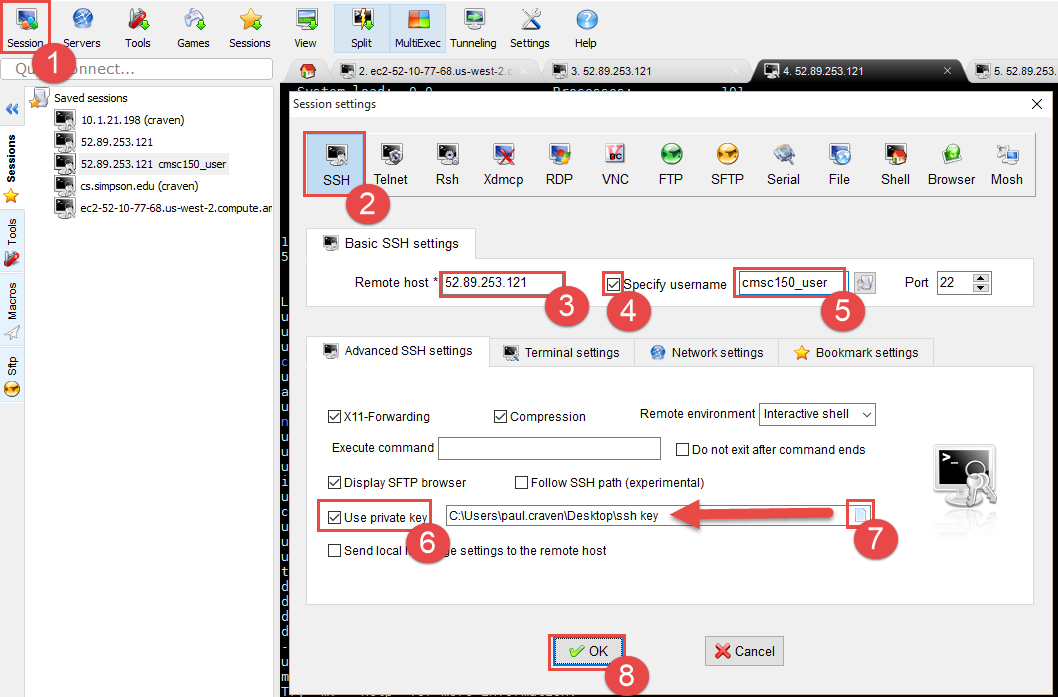
Except: use 52.27.55.158 as the “Remote host”.
Go ahead and connect to the server.
Now we will do the following:
- List all the files that are in the current folder using the
lscommand. - Change the folder we are in to the names folder using the
cdcommand followed by the folder name. - Again, list all the files our new folder.
After doing this, your screen should look like what is below:
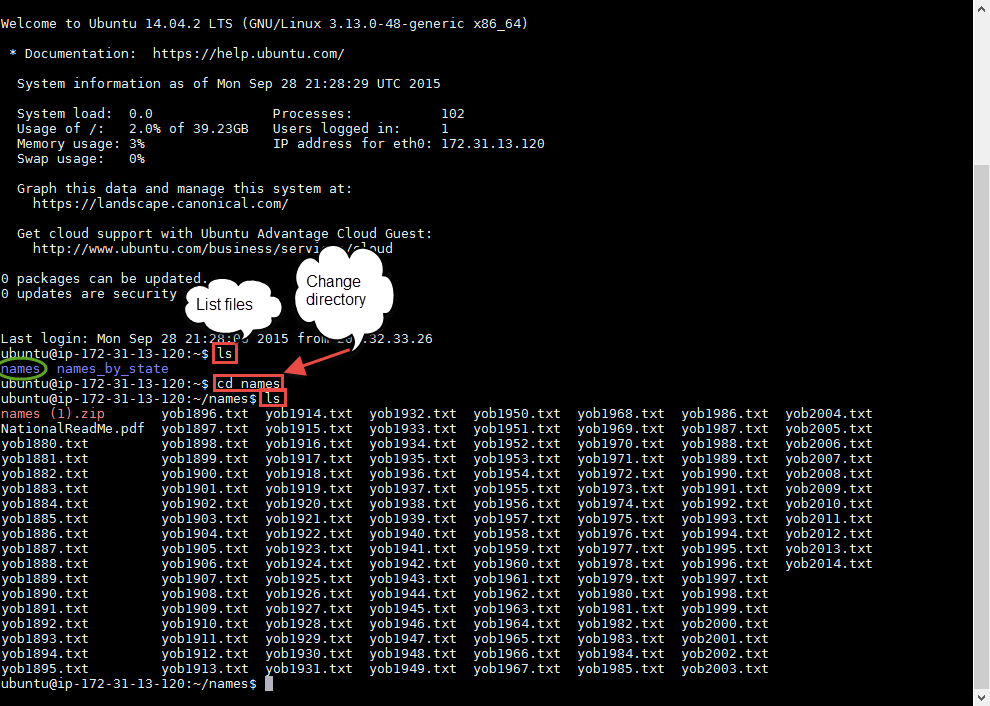
Each of these files contains all the names of births in the United States for that year, along with the count. It does NOT include a name if fewer than five people were born with that name.
We can see the contents of the file by using one of these commands:
cat <filename>List the entire contents of a file. Bad idea because these are really big files. Hit Ctrl-C to stop the list if you do this anyway.head <filename>List the first few lines of a filetail <filename>List the last few lines of a file
That is a lot of data. How much data? Too much to easily count. Thankfully, there is a command that will count it for us.
wc <filename>Count the words in a file
Try it out:

In my example, computer tells you there are 33,044 lines in the file. 33,044 words in the file. And 425,485 characters. You might get different results as you are working on updated data.
Many commands can work on multiple files. You can do this with a “wildcard.” By typing wc *.txt it will run word-count on every single text file in this directory:
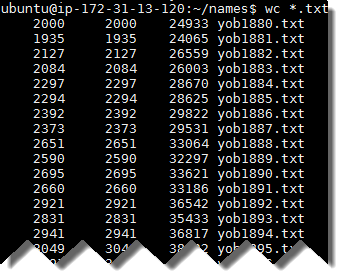
It also gives you a total at the end:
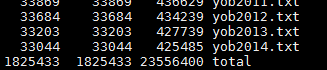
That’s 1,825,433 lines we just counted.
We can use the egrep command to use a regular expression and pull out only
the lines we
are interested in. At this point, we won’t even use a regular expression, we
will just match text. Here I’m looking for every male named “Paul” born:
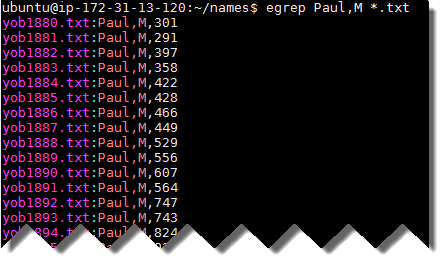
Try this with your name, or some other name you are interested in.
Copying the data
- Select the text in MobaXTerm by click-dragging
- It is automatically copied.
- Switch to Excel and paste
Now we need to get this data into a format we can use.
- Search and replace: Replace ‘yob’ with nothing.
- Search and replace: Replace ‘.txt:’ with a comma.
- Select all the data.
- Click “Data” tab
- Click “Text to Columns”
- Our data is delimited (separated) by commas. So hit ‘Next’
- Click ‘Comma’
- Click ‘Finish’
- Split using text-to-columns and search-and-replace
Figure out how many people are still alive today Use this data to calculate what percent of people born in a certain year are still alive. This data came from the Social Security Administration’s (SSA’s) life tables. It isn’t all that accurate because the death rate is only for a person born in 2013, but it will work for our purposes here. If you plan on being an actuary, you’ll likely use these tables a lot.
Age     Male Percent Alive      Female Percent Alive
0       1.00000 1.00000
1       0.99348 0.99462
2       0.99302 0.99425
3       0.99273 0.99403
4       0.99252 0.99387
5       0.99235 0.99373
6       0.99219 0.99361
7       0.99205 0.99351
8       0.99192 0.99341
9       0.99180 0.99331
10      0.99170 0.99322
11      0.99161 0.99312
12      0.99151 0.99303
13      0.99138 0.99291
14      0.99119 0.99278
15      0.99091 0.99262
16      0.99052 0.99243
17      0.99003 0.99220
18      0.98943 0.99194
19      0.98870 0.99165
20      0.98785 0.99132
21      0.98685 0.99095
22      0.98572 0.99054
23      0.98449 0.99010
24      0.98321 0.98963
25      0.98191 0.98915
26      0.98060 0.98864
27      0.97928 0.98811
28      0.97795 0.98755
29      0.97659 0.98697
30      0.97519 0.98635
31      0.97376 0.98569
32      0.97230 0.98500
33      0.97080 0.98426
34      0.96927 0.98348
35      0.96772 0.98265
36      0.96612 0.98176
37      0.96448 0.98081
38      0.96277 0.97979
39      0.96097 0.97870
40      0.95908 0.97753
41      0.95708 0.97627
42      0.95493 0.97491
43      0.95262 0.97343
44      0.95012 0.97182
45      0.94739 0.97004
46      0.94441 0.96810
47      0.94115 0.96597
48      0.93759 0.96364
49      0.93368 0.96109
50      0.92940 0.95829
51      0.92472 0.95524
52      0.91961 0.95193
53      0.91406 0.94834
54      0.90804 0.94449
55      0.90153 0.94038
56      0.89450 0.93598
57      0.88693 0.93126
58      0.87883 0.92623
59      0.87022 0.92090
60      0.86112 0.91526
61      0.85147 0.90927
62      0.84125 0.90287
63      0.83042 0.89600
64      0.81899 0.88858
65      0.80691 0.88054
66      0.79412 0.87177
67      0.78054 0.86223
68      0.76613 0.85187
69      0.75084 0.84069
70      0.73461 0.82864
71      0.71732 0.81561
72      0.69889 0.80147
73      0.67930 0.78616
74      0.65853 0.76961
75      0.63657 0.75177
76      0.61329 0.73244
77      0.58859 0.71148
78      0.56249 0.68888
79      0.53504 0.66467
80      0.50629 0.63880
81      0.47621 0.61114
82      0.44484 0.58159
83      0.41233 0.55016
84      0.37890 0.51694
85      0.34482 0.48205
86      0.31040 0.44565
87      0.27598 0.40796
88      0.24201 0.36933
89      0.20896 0.33017
90      0.17735 0.29104
91      0.14768 0.25257
92      0.12043 0.21542
93      0.09599 0.18027
94      0.07463 0.14775
95      0.05647 0.11839
96      0.04157 0.09267
97      0.02977 0.07083
98      0.02075 0.05285
99      0.01410 0.03852
100     0.00935 0.02745
101     0.00605 0.01909
102     0.00380 0.01292
103     0.00232 0.00850
104     0.00137 0.00541
105     0.00078 0.00333
106     0.00043 0.00197
107     0.00023 0.00112
108     0.00011 0.00061
109     0.00005 0.00031
110     0.00002 0.00015
111     0.00001 0.00007
112     0.00000 0.00003
113     0.00000 0.00001
Create a graph similar to the following for your name of choice:
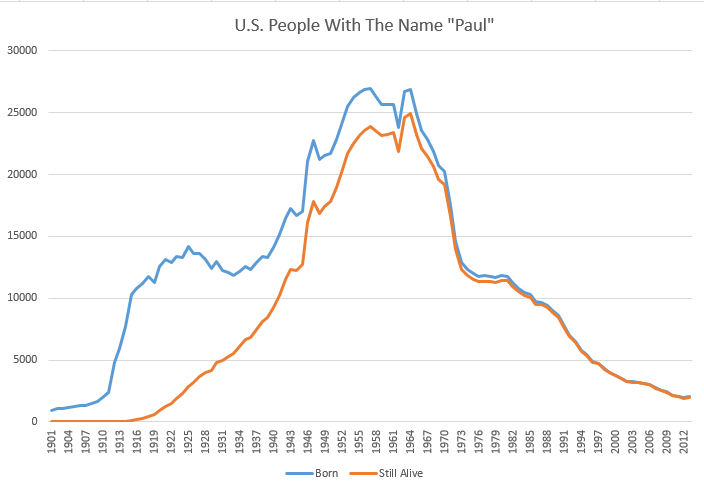
We could actually process the data and create the graph completely with the command line. That’s a bit more involved than this tutorial will get into. But know this: it is possible to automatically create one of these graphs for every single name.